In the pre-industrial era volcanic CO2 emissions played a major role in controlling atmospheric CO2 concentrations, balanced by the effects of weathering which removes CO2 from the atmosphere. Together, these two processes determined CO2 concentrations for billions of years, and therefore also the global temperatures via the greenhouse effect. Over the last 600 million years the CO2 concentration in the atmosphere has been relatively stable, see figure 1.
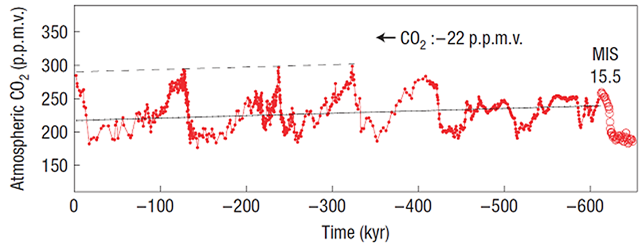
Figure 1: Late Pleistocene CO2 records from Zeebe and Caldeira, 2008. The red curve shows combined data from Antarctic ice cores at Dome C and Vostok. Solid black lines indicate long-term trends and errors based on linear regression of the truncated, interpolated data sets. The same trend in CO2 shifted vertically (dashed line) shows that maximum values have also declined during the past four interglacials.
Recent work (Zeebe and Caldeira, 2008) supports the hypothesis (Berner et al., 1998) that CO2 concentrations were controlled by an efficient feedback system whereby the rate of CO2 removal from the atmosphere by weathering was itself a function of temperature, controlled by CO2 atmospheric concentration. Thus, a low CO2, cooler planet would have a lower weathering rate, and volcanic emissions of CO2 would build up, increasing the CO2 concentration until temperatures rose and weathering was fast enough to maintain a steady concentration. This stability has allowed life to flourish on Earth for the last 20 million years, enjoying relatively stable temperatures notwithstanding changes in solar insolation due to orbital variations.
The rapid increase in CO2 emissions from human activity has broken this equilibrium, as weathering rates have not increased quickly enough to draw down the CO2 concentrations. In order to understand this geochemical cycle we must quantify the input from volcanism and metamorphism and the output from weathering. Magmatic degassing has been the primary source of CO2 to the Earth, via degassing at mid-ocean ridges (MORs), hotspots and arc volcanism. In terms of net inputs MOR CO2 release is at least balanced by crustal alteration (Varekamp et al., 1992), and so this is not a net source of CO2 into the exosphere. Hotspots and plumes are estimated to contribute 80-132 Mt/yr (1 Mt = 1012 g) (Varekamp, 1992; Marty and Tolstikhin, 1998) and subduction arc volcanism 66-135 Mt/yr (Varekamp, 1992, Sano and Williams, 1996) of CO2, producing a total range between 146-267 Mt/yr.
Current estimates of the weathering removal rate of CO2 vary widely, ranging from 380 Mt/yr (Gaillardet et al., 1999) to 880 Mt/yr (Varekamp and Thomas, 1998). There is clearly a lot of uncertainty about the global geochemical cycle. Hard data are either difficult to collect directly (in the case of the global weathering rate) or have been produced by inferences and assumptions. The situation is particularly egregious for the volcanic emissions. Of approximately 500 active volcanoes in the world at any one time, passively or explosively releasing CO2 into the atmosphere, only ~10 have had direct measurements of their CO2 flux determined by measuring CO2/SO2 ratios in the plume at the same time as the SO2 flux has been measured, see table 1. This is currently the only quantitative methodology we have at our disposal for the determination of CO2 fluxes from degassing volcanoes. The total volcanic CO2 flux that has actually been verified is therefore ~30 Mt/yr, yet estimates of 300 Mt/yr are now commonly used in the literature (e.g Morner and Etiope, 2002). Such estimates are normally derived by combining the more widely measured SO2 flux (still only ~30% of active volcanoes have been measured for SO2 flux) with fumarolic measurements of CO2/SO2 emissions. Such measurements can be quite accurate representations of the true plume CO2/SO2 ratio (Edmonds et al., 2010), but they are not always, particularly if they are contaminated with lower temperature hydrothermal systems, which is often the case (Fischer, 2008).
| Volcano | Country | CO2 flux (Mt/yr) | Reference |
|---|---|---|---|
| Nyiragongo | DR Congo | 15.3 | Sawyer et al., 2008 |
| Etna | Italy | 4.75 | Aiuppa et al., 2008 |
| Kilauea | USA | 1.83 | Gerlach et al., 1998 |
| Masaya | Nicaragua | 1.1 | Burton et al., 2000 |
| Soufriere Hills | Montserrat | 1.0 | Edmonds et al., 2010 |
| Stromboli | Italy | 0.37 | Burton et al., 2007 |
Table 1: Selection of volcanoes with measured CO2 fluxes
This enormous uncertainty in our knowledge of a critical input into the global geochemical cycle led Berner and Lagasa (1989) to state that it is the most vexing problem facing us in understanding that cycle. On the contrary however, if we were to finally derive a quantitative measurement of the volcanic CO2 flux we would be able to place the whole geochemical cycle on a much sounder footing, converting uncertainty and guesswork about one of the most fundamental aspects of our planet’s behaviour into a solid scientific framework. In turn, this would allow us to better understand the likely impact large eruptions have had in Earth’s history, by comparing them with annual background degassing amount. We may also ascertain the true natural contribution compared to the anthropogenic CO2 flux.
References
- Aiuppa, A., G. Giudice, S. Gurrieri, M. Liuzzo, M. Burton, T. Caltabiano, A. J. S. McGonigle, G. Salerno, H. Shinohara, and M. Valenza (2008), Total volatile flux from Mount Etna, Geophys. Res. Lett., 35, L24302, doi:10.1029/2008GL035871
- Berner, R. A., Lasaga, A. C., Garrels, R. M. The carbonate-silicate geochemical cycle and its effect on
atmospheric carbon dioxide over the past 100 million years. Am. J. Sci. 283, 641–683 (1983).
- Berner, R.A., Lasaga, A.C., 1989, Modeling the Geochemical Carbon Cycle, Scientific American, 260, 3
Burton, M.R., C. Oppenheimer, L. Horrocks, P.W. Francis, Remote sensing of CO2 and H2O emission rates from Masaya volcano, Nicaragua, 2000, Geology, 28, 10, 915–918
- Burton M. R., P. Allard, F. Mure, A. La Spina, 2007, Magmatic gas composition reveals the source depth of slug-driven Strombolian explosive activity, Science, 317, 5835, 227-230, doi: 10.1126/science.1141900
- Edmonds et al., 2010, Excess volatiles supplied by mingling of mafic magma at an andesite arc volcano, G3, 11, 4, doi:10.1029/2009GC002781
- Fischer, T.P., Fluxes of volatiles from arc volcanoes, 2008, Geochemical Journal, 42, 21-38
Fiorani L., Colao F., Palucci A., 2009, Measurement of Mount Etna plume by CO2-laser-based lidar Optics Letters 34, 800-802.
- Gaillardet J., Dupre´ B., ,Louvat P., Allegre, C.J., 1999, Global silicate weathering and CO consumption rates deduced from the chemistry of large rivers, Chemical Geology 159, 3–30.
- Gerlach T.M., K.A. McGee, A.J., Sutton, T. Elias, 1998, Rates of volcanic CO2 degassing from airborne determinations of SO2, emission rates and plume CO2/SO2: Test study at Pu'u 'O'o cone, Kilauea volcano, Hawaii, Geophysical Research Letters, 25, 14, 2675-2678.
- Morner N-A., Etiope, G., 2002, Carbon degassing from the lithosphere, Global and planetary change, 33, 185-203.
- Sano Y., Williams S., 1996, Fluxes of mantle and subducted carbon along convergent plate boundaries,
Geophysical Research Letters, 23, 20, 2749-2752.
- Sawyer, G. M., S. A. Carn, V. I. Tsanev, C. Oppenheimer, and M. Burton (2008), Investigation into magma degassing at Nyiragongo volcano, Democratic Republic of the Congo, Geochem. Geophys. Geosyst., 9, Q02017, doi:10.1029/2007GC001829.
- Varekamp J.C., Kreulen R., Poorter RPE.Van Bergen, 1992, Carbon sources in arc volcanism, with implications for the carbon cycle, Terra Nova, 4, 3, 363, DOI: 10.1111/j.1365-3121.1992.tb00825.
- Varekamp J.C., Thomas E., 1998, Volcanic and anthrophenic contributions to global weathering budgets, J. Geochemical Exploration, 62, 149-159.
- Werner C. et al., 2008, Variability of passive gas emissions, seismicity, and deformation during crater lake growth at White Island Volcano, New Zealand, 2002-2006, JGR Solid Earth, 113, B01204, 15pp, DOI: 10.1029/2007JB005094.
- Zeebe and Caledeira, 2008, Close mass balance of long-term carbon fluxes from ice-core CO2 and ocean chemistry records, Nature Geoscience, doi:10.1038/ngeo185